A simple graphviz example

The following code shows how to use Image_GraphViz the easiest way possible - generate a simple directed graph and send it as SVG image to the browser.

<?php
require_once 'Image/GraphViz.php';

$gv = new Image_GraphViz();
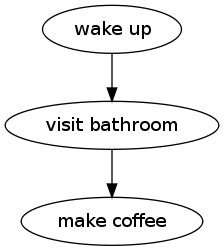
$gv->addEdge(array('wake up'        => 'visit bathroom'));
$gv->addEdge(array('visit bathroom' => 'make coffee'));
$gv->image();
?>

The example above will display in your browser as follows:

Simple example output

The constructor does not need any parameters, but one may tell it if the graph is directed, an array of attributes and the name of the graph.

To generate content, serveral methods are available: addEdge(), addNode(), and addCluster().

Calling graphviz' dot or neato is being done by Image_GraphViz implicitly when calling image() or fetch(). Both can be used to generate and display/return image data in a large number of image formats, including svg, png, pdf and plain text.

About Image_GraphViz (Previous) Image_Text (Next)
Last updated: Sat, 16 Feb 2019 — Download Documentation
Do you think that something on this page is wrong? Please file a bug report.
View this page in:
  • English

User Notes:

Note by: info@darrencampbell.com.au
It is also possible for your script to become the "image" without having to first save the image to a file.

You could also just set appropriate content headers and emit the raw PNG image stream.

Here's an example from stackoverflow for JPG output from the GD library but this can easily be adapted for PNG from graphviz:

http://stackoverflow.com/questions/1353850/serve-image-with-php-script-vs-direct-loading-image

i.e setting the content type, cleaning/flushing the buffer and emitting the image:
header("Content-type: image/png");
ob_clean();
flush();
echo $gv->fetch('png');
Note by: thefriendlycoder@gmail.com
TIP: The last paragraph in the example suggests that you can use this sample code to generate binary representations of the graph using the same syntax. This is a bit misleading and it isn't obvious why until you do some digging.

For example, the $gv->image() method takes an optional parameter indicating the format of the resulting image. If you dig around you will find that this parameter may be one of several character strings including 'png', 'jpg' and 'pdf'. Further, if you take the example here verbatim and add, say, 'png' as the input parameter to the image call you get no result displayed on the generated page and the reason for this is non-obvious (it just took me several hours or reading, googling, debugging, etc. to find the solution).

To make a long story short, the result returned from the call to image() is a raw data stream with a representation of the graph you are creating in the format you requested. If you specify 'png' then the return value will be a byte-stream representing the raw PNG image data.

What you need to do here is add some extra code to save this raw binary data to a temporary file and then encode some HTML in the PHP script to reference that file with an IMG tag. Here is some sample code I used with the example here:

//save the PNG image data to a temporary PNG file
$file = fopen("test.png", "wb");
$raw_data = $gv->fetch('png');
fwrite ($file, $raw_data, strlen($original_data));
fclose($file);

//now create an HTML image that refereces that temporary file
echo '<img src="test.png" />';

Otherwise, I am happy so far with PEAR and the Image_GraphViz package. Great work guys. Also, it would be nice to get a ping-back to my blog at www.thefriendlycoder.com if you wouldn't mind.
Note by: thefriendlycoder@gmail.com
TIP: In this example, the call to $gv->image() will return the graph formatted as SVG markup. If your browser does not support SVG then you will not get the graphic shown in the example.